

Is Bitcoin Cash making a comeback? After years of trading in Bitcoin’s shadow, BCH is quietly building momentum. Whether you’re a seasoned crypto trader or just exploring your options, understanding where BCH might head over the next five years could shape some smart investment decisions.
This guide breaks down the Bitcoin Cash price prediction from 2026 to 2030 using real data, expert analysis, and honest market context.
What Is Bitcoin Cash (BCH)?
Back in 2017, a fierce debate split the Bitcoin community. One side wanted bigger block sizes to handle more transactions. The other preferred keeping blocks small. The result? A hard fork that created Bitcoin Cash.
BCH runs on the same proof-of-work system as Bitcoin but processes transactions faster and cheaper. Its block size sits at 32MB compared to Bitcoin’s 1MB. That means more transactions per block and fees that often cost less than a penny.
| Feature | Bitcoin (BTC) | Bitcoin Cash (BCH) |
| Block Size | 1MB | 32MB |
| Avg Fee | $2 to $5 | Under $0.01 |
| Primary Use | Store of Value | Daily Payments |
| Max Supply | 21 million | 21 million |
BCH targets everyday payments. Think buying coffee, sending money abroad, or paying a freelancer. That real-world utility is central to its long-term value case.
BCH Price Prediction: Expert Analysis Overview
Forecasting crypto prices is part science, part educated guesswork. However, several respected platforms have weighed in on BCH’s trajectory heading toward 2030.
Here’s what the data broadly suggests:
- CoinCodex projects moderate growth tied closely to Bitcoin halving cycles
- PricePrediction.net leans bullish for 2028 and 2029 based on historical patterns
- Changelly sees BCH reaching new multi-year highs if broader market conditions cooperate
- DigitalCoinPrice flags regulatory clarity in the US as a major price catalyst
Most analysts agree on one thing. BCH doesn’t move in isolation. Its price is deeply tied to Bitcoin’s momentum and overall market sentiment.
Current Market Background
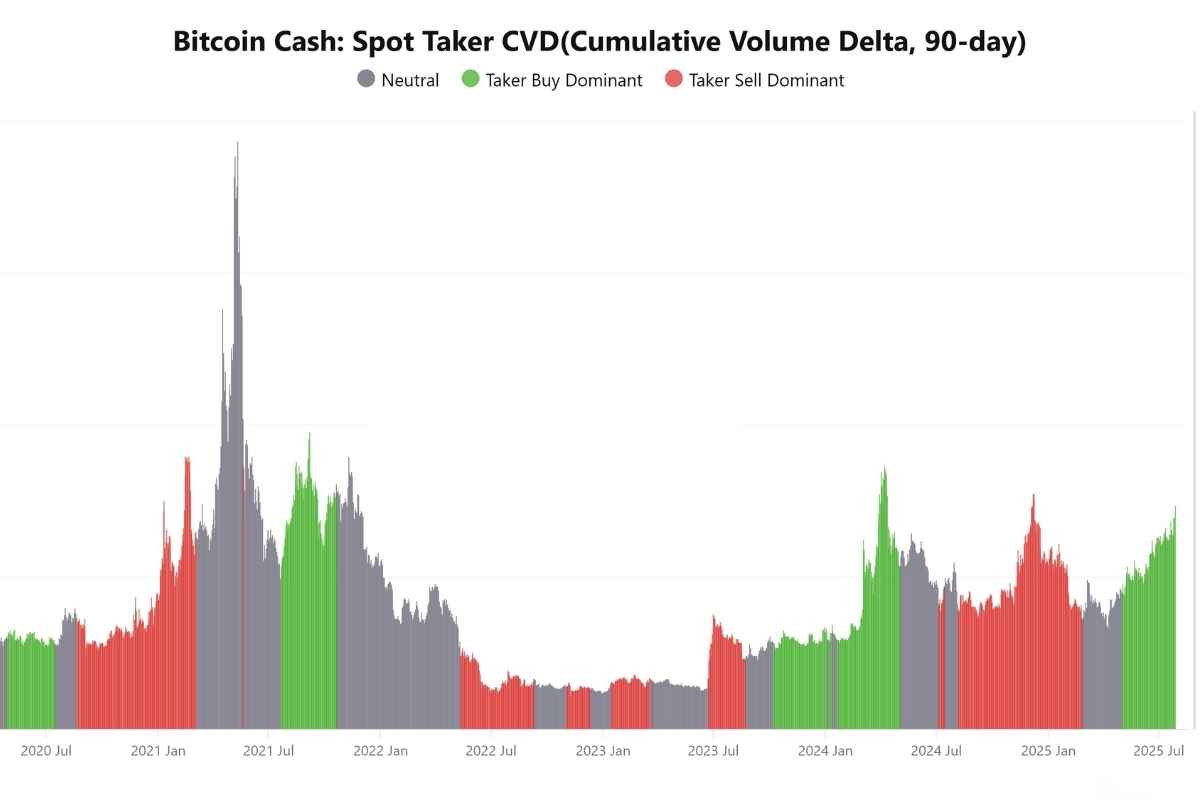
BCH hit its all-time high of roughly $4,355 in December 2017. It hasn’t come close since. That gap between its peak and its current price tells you everything about how the market views BCH today.
Right now BCH trades as a mid-tier altcoin with a respectable but not dominant market cap. After the 2024 Bitcoin halving the broader altcoin market saw renewed interest and BCH participated in that rally though not as aggressively as some newer projects.
A few things US investors are watching closely:
- The SEC’s ongoing stance on crypto classifications
- Bitcoin ETF inflows and whether institutional money trickles into altcoins
- Merchant adoption of BCH as a payment tool in the US market
- Correlation with BTC which remains the primary driver of altcoin cycles
For live price data check CoinMarketCap BCH.
BCH Technical Analysis
Technical analysis won’t tell you exactly where BCH is headed. Think of it like weather forecasting. It gives you probabilities not certainties.
Key Price Levels
Understanding support and resistance is essential before making any position decisions.
Support Levels
Support is the price floor where buyers tend to step in and stop a decline.
- Primary support zone sits near recent consolidation lows
- The 200-day moving average acts as dynamic support in bull markets
- Psychological levels like $200 and $300 attract buyers historically
When BCH breaks below strong support it often signals a deeper correction is coming.
Resistance Levels
Resistance is the ceiling BCH keeps testing without breaking through.
- Near-term resistance aligns with the most recent swing highs
- Mid-term resistance sits near the 2021 bull market peaks
- The all-time high around $4,355 represents the ultimate long-term ceiling
A clean break above resistance typically triggers fresh buying momentum.
What to Watch Closely
Before making any BCH trade or long-term investment decision keep these signals on your radar:
- RSI readings above 70 suggest overbought conditions
- MACD crossovers signal trend shifts early
- Rising on-chain transaction volume points to genuine network usage
- Exchange outflows often signal hodlers accumulating rather than selling
- Bitcoin dominance dropping usually benefits altcoins including BCH
Read More Post: Chainlink (LINK) Price Prediction 2025, 2026 to 2030
BCH Price Prediction 2026
2026 sits in the sweet spot following the 2024 halving. Historically the 12 to 18 months after a Bitcoin halving produce strong altcoin performance.
Bullish case: US regulatory clarity boosts investor confidence and BCH benefits from renewed interest in low-fee payment coins. Merchant adoption could tick higher as crypto becomes more mainstream in American commerce.
Bearish case: If Bitcoin dominance stays elevated altcoins struggle to gain traction regardless of fundamentals.
| Scenario | BCH Price Prediction 2026 |
| Bearish | $180 to $300 |
| Base Case | $400 to $600 |
| Bullish | $800 to $1,200 |
BCH Price Prediction 2027
By 2027 the post-halving cycle typically starts maturing. Some altcoins peak early and retrace hard. Others with genuine utility hold their gains better.
BCH’s payment focus gives it a real narrative in 2027 if crypto adoption in everyday US commerce continues growing. However competition from stablecoins and newer payment protocols is a genuine threat that can’t be ignored.
| Scenario | BCH Price Prediction 2027 |
| Bearish | $150 to $250 |
| Base Case | $350 to $550 |
| Bullish | $700 to $1,000 |
BCH Price Prediction 2028
Here’s where things get interesting. 2028 is another Bitcoin halving year. Every previous halving has eventually preceded a significant bull run. BCH has historically followed Bitcoin’s post-halving trajectory with some lag.
If the 2028 cycle mirrors 2020 to 2021 BCH could see serious price appreciation in the second half of the year and into 2029.
| Scenario | BCH Price Prediction 2028 |
| Bearish | $200 to $400 |
| Base Case | $500 to $900 |
| Bullish | $1,000 to $1,800 |
BCH Price Prediction 2029
Post-halving bull markets have historically peaked roughly 12 to 18 months after the halving event. That puts 2029 in prime position as a potential peak year for this cycle.
If BCH follows historical patterns and the broader market enters a strong bull phase BCH could challenge multi-year highs. That said the crypto landscape by 2029 will look very different from today. New competitors will emerge. Regulation will reshape the field.
| Scenario | BCH Price Prediction 2029 |
| Bearish | $250 to $450 |
| Base Case | $700 to $1,200 |
| Bullish | $1,500 to $2,500 |
BCH Price Prediction 2030
By 2030 Bitcoin Cash will either have carved out a genuine niche as a global payment network or it will have faded behind faster-moving competitors. There’s not much middle ground in a market this competitive.
The optimistic view is that BCH’s simplicity and low fees become genuinely valuable in a world where crypto payments are mainstream. The pessimistic view is that stablecoins and newer chains have eaten BCH’s lunch by 2030.
| Year | Bearish | Base Case | Bullish |
| 2026 | $180 to $300 | $400 to $600 | $800 to $1,200 |
| 2027 | $150 to $250 | $350 to $550 | $700 to $1,000 |
| 2028 | $200 to $400 | $500 to $900 | $1,000 to $1,800 |
| 2029 | $250 to $450 | $700 to $1,200 | $1,500 to $2,500 |
| 2030 | $300 to $500 | $800 to $1,400 | $2,000 to $3,500 |
Final Thoughts
Bitcoin Cash carries real utility and a loyal community behind it. But it also carries baggage from years of narrative battles and market underperformance. The 2026 to 2030 window gives BCH a genuine shot at redemption if halving cycles play out historically and US adoption grows.
Invest only what you can afford to lose and always do your own research before making any decisions. Want to buy BCH? Start with trusted US platforms like Coinbase or Kraken.

